
Nick Shugg provides the June 2018 performance tables to facilitate a more meaningful guide to the performance of SMSF investment portfolios.
In April, I made the observation the risk premium had not been justified over the past 12 months at that time. Because financial stocks had been hit hard, there was not a significant difference between the returns of the very conservative investor and the very assertive.
But in June, Australian financial stocks rebounded strongly. This sector outperformed resources and indeed outperformed 23 of the 25 other sub-asset classes we monitor on the Australian Securities Exchange. The only sectors that performed better were oil and international listed property.
As a result, when we look at the 2018 financial year performance for SMSFs, it’s looking more in line with the normal risk/return relationship we expect to see.
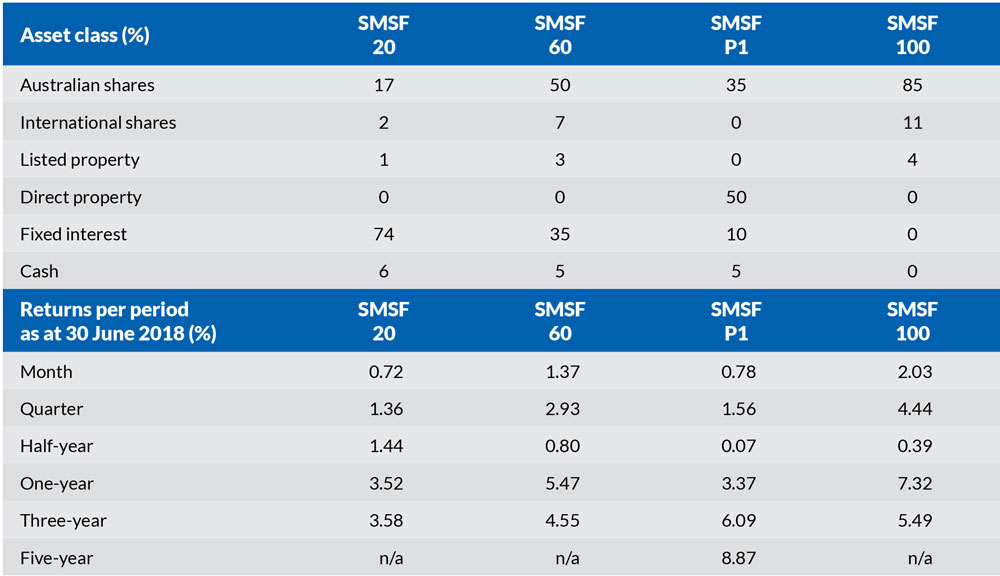
SMSF 100 Investors (those with an allocation to 100 per cent growth assets) enjoyed a 7.32 per cent return over that period, while SMSF 20 investors (those with an allocation to 20 per cent growth assets) experienced a return of 2.57 per cent over the year. So that’s a reward of nearly five percentage points for taking the market risk over this period.
Meanwhile, SMSF P2 investors, who have a 100 per cent allocation to direct property (not shown in the selected benchmark portfolios below), performed even worse than those in cash as rising interest rates continued to lead to negative growth in most cities. Regional centres and Hobart have been an exception, but there are proportionally fewer SMSFs in these areas compared to Sydney, Melbourne and Brisbane.
What’s hot
The United States share market continues to defy the odds. It has delivered a return of 18.26 per cent over the past year. Let’s not gloss over how high that is. But the scary thing is, it has delivered an average annual return over the past five years of 18.26 per cent.
I recently attended a function with a number of fund managers who all believed we are in a mature stage of the cycle. But as professional investors they can’t pull everything out of the market, often because their fund mandates don’t allow it and also because you can be wrong for a long time before reason kicks in.
What’s not
Meanwhile, as the share market continues to go well, gold as a sub-asset class has been the worst performing of the 26 sub-asset classes we monitor over the past month, quarter, half-year and year. It is behaving with a negative correlation to the share market as usual.
Another sub-asset class that has just started to slide over the past two months is Asia excluding Japan.
As at 30 April, the one-year return was 27.34 per cent and the five-year annual return was 17.39 per cent, which made it one of the top-performing sectors.
It has started to come off those highs and the one-year return as at 30 June was 16.68 per cent.
Disclaimer: 1. These Benchmark Portfolios should not be taken as any form of advice. They are designed for information only. Speak to your professional adviser before taking any action. 2. While SMSF Benchmarks Pty Ltd has taken every care in preparation of this information, the company, its directors and/or employees cannot be held responsible for any loss caused by action taken resulting from these benchmark portfolios. 3. Past returns are no guarantee of future returns.