
Nick Shugg provides the latest SMSF tables to assess how well client investment portfolios are performing and analyses the strongest asset classes currently.
Maybe, just maybe, SMSF trustees are starting to behave more like investors and less like speculators. If so, this would be an important step in protecting our economy because of the amount of money (some $700 billion) tied up in SMSFs.
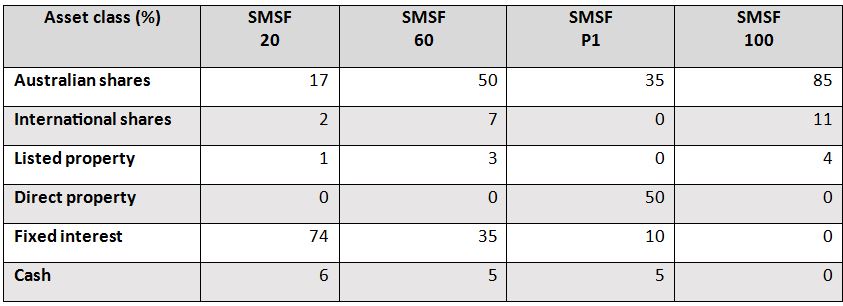
In our SMSF performance table, we use a ‘look through’ method to estimate the weighting SMSFs have to international shares. In other words, we look through listed and unlisted trusts to understand what the underlying assets are likely to be. In December 2017 we estimated that across all SMSFs around 11 per cent invested in international shares.
Of course, not all SMSFs have the same risk profile. Some are more conservative than others, so we go further and use this information to estimate the weighting of international shares (and other asset classes) that exist within 11 benchmark portfolios, ranging from the very conservative to the very assertive.
Recent research indicates that over the past year SMSFs have increased their diversity. They may now have up to 14 per cent in international shares, although this figure is likely to be somewhat overstated as the source of the survey was tilted towards advised SMSFs.
Exchange-traded funds (ETF) have made it easy for SMSFs to include international shares as well as government bonds and broader fixed interest in their portfolio mix.
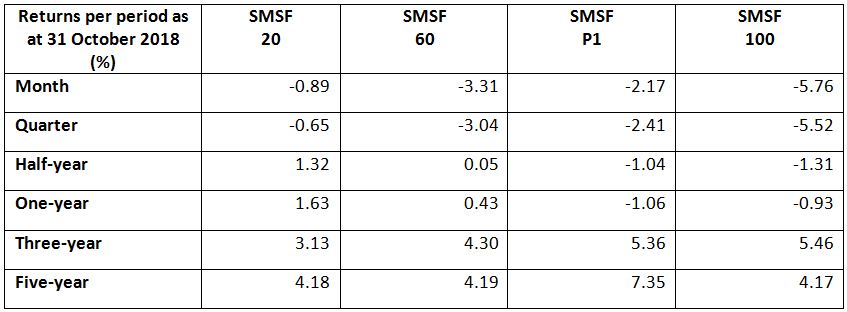
How has this increased diversity affected SMSFs over the past year?
After the downturn in October, the one-year return for Australian high-yield shares was negative 3.7 per cent, whereas the one-year return from United States shares was 15.78 per cent despite coming off 5 per cent in October.
The one-year return from Australian fixed interest was 2.86 per cent.
Therefore, it seems likely the trend to use ETFs to increase diversity over the past year has benefited SMSFs and has reduced further downside risk.
What’s hot
It wasn’t long ago the author was attending conferences about Brazil, Russia, India and China, or the BRIC economies. They were about to become the economic superpowers. Developed economies were going to lose ground, according to many economists and fund manager marketing departments.
But in fact over the past year the sub-asset class of emerging markets returned negative 5.07 per cent a year, compared to an annualised return on US shares at 15.78 per cent. This strong outperformance by the US market has been the case over the past five years.
The transfer of power to the developing economies may still happen, but it is yet another example of how one can get it horribly wrong in the short to medium term by investing heavily in one area while ignoring others.
International value companies returned 10.64 per cent over the 12 months to 31 October, while global healthcare delivered a healthy 13.1 per cent.
Both these sub-asset classes fell in line with the overall market movement in October. They did not give up more ground than other sectors despite their strong run.
Infrastructure (global), gold and fixed income were the winners in October.
What’s not
Asia ex-Japan, with a negative return of 10.12 per cent, and oil, producing a negative return of 10.65 per cent, were the biggest losers in October.
Disclaimer: 1/ These Benchmark Portfolios should not be taken as any form of advice. They are designed for information only. Speak to your professional adviser before taking any action. 2/ While SMSF Benchmarks Pty Ltd has taken every care in preparation of this information, the company, its directors and/or employees cannot be held responsible for any loss caused by action taken resulting from these benchmark portfolios. 3/ Past Returns are no guarantee of future returns.
''