
Nick Shugg provides more relevant performance tables against which SMSF trustees can measure the performance of their funds, in what will be a regular newsletter feature.
The ATO recently released its annual statistical report on SMSFs as at 30 June 2016.
A headline figure was that the estimated average return for SMSFs in 2015/16 was 2.9 per cent.
So how did your SMSF perform? You could compare it against the 2.9 per cent figure, but that’s looking at 600,000 funds investing in all kinds of different ways. Wouldn’t it be better to compare with others who had invested in a similar way to you?
I have noticed lately that trustees are starting to feel comfortable to share information about their returns and how they are investing. This is great, because we can all learn from each other.
I joined an online conversation recently where one SMSF trustee was happy to share the fact his return for the 2016 year was 12.8 per cent. He added that he benchmarks his return against the SR 50 Balanced Index published by SuperRatings.
The index in question is very useful when assessing how a large super fund has performed compared to other large super funds, but is it useful for SMSFs?
Put simply, no it is not.
The SR 50 Balanced Index measures the average return of the balanced options in the 50 largest public offer super funds, which have a very different asset mix compared to most SMSFs.
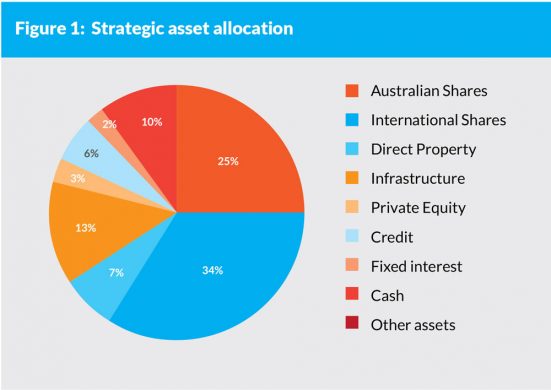
Let’s have a look at the AustralianSuper Balanced option as an example (Figure 1).
How many SMSFs have more International shares than Australian equities? Not many.
How many have a 13 per cent allocation to infrastructure? Even fewer.
When you look at the ATO’s breakdown of how SMSFs are investing, it is very different to what the larger funds are doing. So finding relevant benchmarking is a problem for trustees. What can you do?
At SMSF Benchmarks, we’re doing two things:
Firstly, we are getting crowdsourced data (de-identified) so we can help SMSF trustees compare their balance, returns and risk levels against other SMSFs, others in their age group, others in the same phase and others investing in a similar way to them.
Secondly, we have designed benchmark portfolios specifically for SMSFs, based on how they are investing, according to ATO statistical reports and academic research.
Our aim in doing this is to give the whole SMSF community better information to allow for better decisions and hopefully help trustees achieve better outcomes over time.
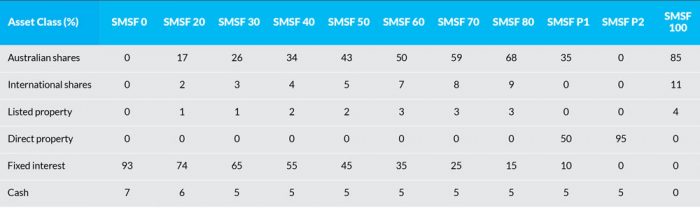
We have created nine benchmark portfolios tabled below, broadly based on deciles of growth assets, but more in line with how SMSFs invest, plus two benchmark portfolios catering for SMSFs with direct property. You can read more about this in a white paper in our knowledge centre.
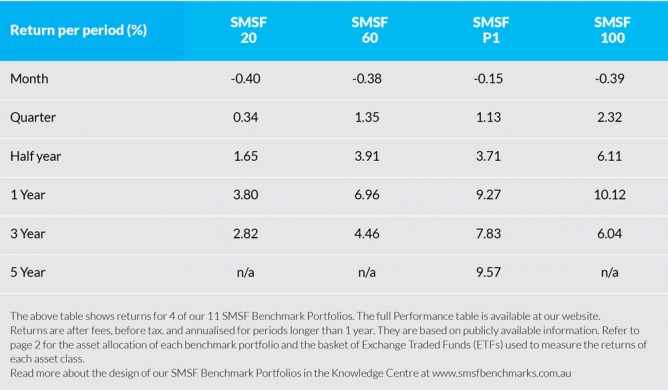
Each month in smstrusteenews we will publish the returns of a selection of the SMSF benchmark portfolios.
We begin with returns for four of them as at 31 January, 2018.
Please note, a six-month subscription to the full SMSF Benchmarks Performance Table is available at no charge until the end of March. Simply email [email protected] and ask for your monthly performance table.
''