
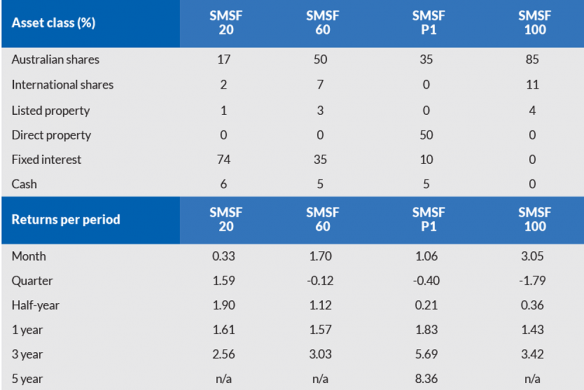
Nick Shugg provides the April 2018 performance tables to facilitate a more meaningful comparison as to how SMSF investment portfolios are performing.
Over the March quarter, investors in the purely defensive portfolio SMSF 0, with the majority of allocations to cash and cash-equivalent products, would have outperformed investors in the purely growth SMSF 100, with an 86 per cent allocation to Australian equities, 10 per cent allocation to global equities and a 4 per cent allocation to listed property, by around 3 per cent.
But in April, the reverse was true. This uncertainty in market direction resulted in the one-year returns across the range of portfolios being the most even we have seen for some time.
However, the return picture changes as the investment timeline spans a greater period. Over the past three years, SMSF 100 investors outperformed SMSF 0 investors by 1.14 per cent.
However, it is a legitimate question to ask whether the additional volatility over this period has really been worthwhile. For example, would SMSF 100 investors have been better with a more diversified SMSF 60 portfolio, one with only 52 per cent in domestic shares, 6 per cent in international stocks, 2 per cent in listed property, 35 per cent in fixed income and 5 per cent in cash, which would have delivered a similar return but with a lower overall volatility? Statistics show the risk premium has not really been there over this three-year period.
During April, Australian financials (as a sector) delivered a return of 0.15 per cent compared to the broad market, which generated a return of 3.85 per cent. That is a big difference. At the same time, Australian high-yield shares (as a sub-asset class) produced a return of 2.74 per cent, demonstrating that allocations to exchange-traded funds with high-yield stocks as the underlying asset are spreading assets over more than just financials.
Disclaimer: 1. These Benchmark Portfolios should not be taken as any form of advice. They are designed for information only. Speak to your professional adviser before taking any action. 2. While SMSF Benchmarks Pty Ltd has taken every care in the preparation of this information, the company, its directors and/or employees cannot be held responsible for any loss caused by action taken resulting from these benchmark portfolios. 3. Past returns are no guarantee of future returns.
You can read more about the design of our SMSF Benchmark Portfolios in the Knowledge Centre at www.smsfbenchmarks.com.au.